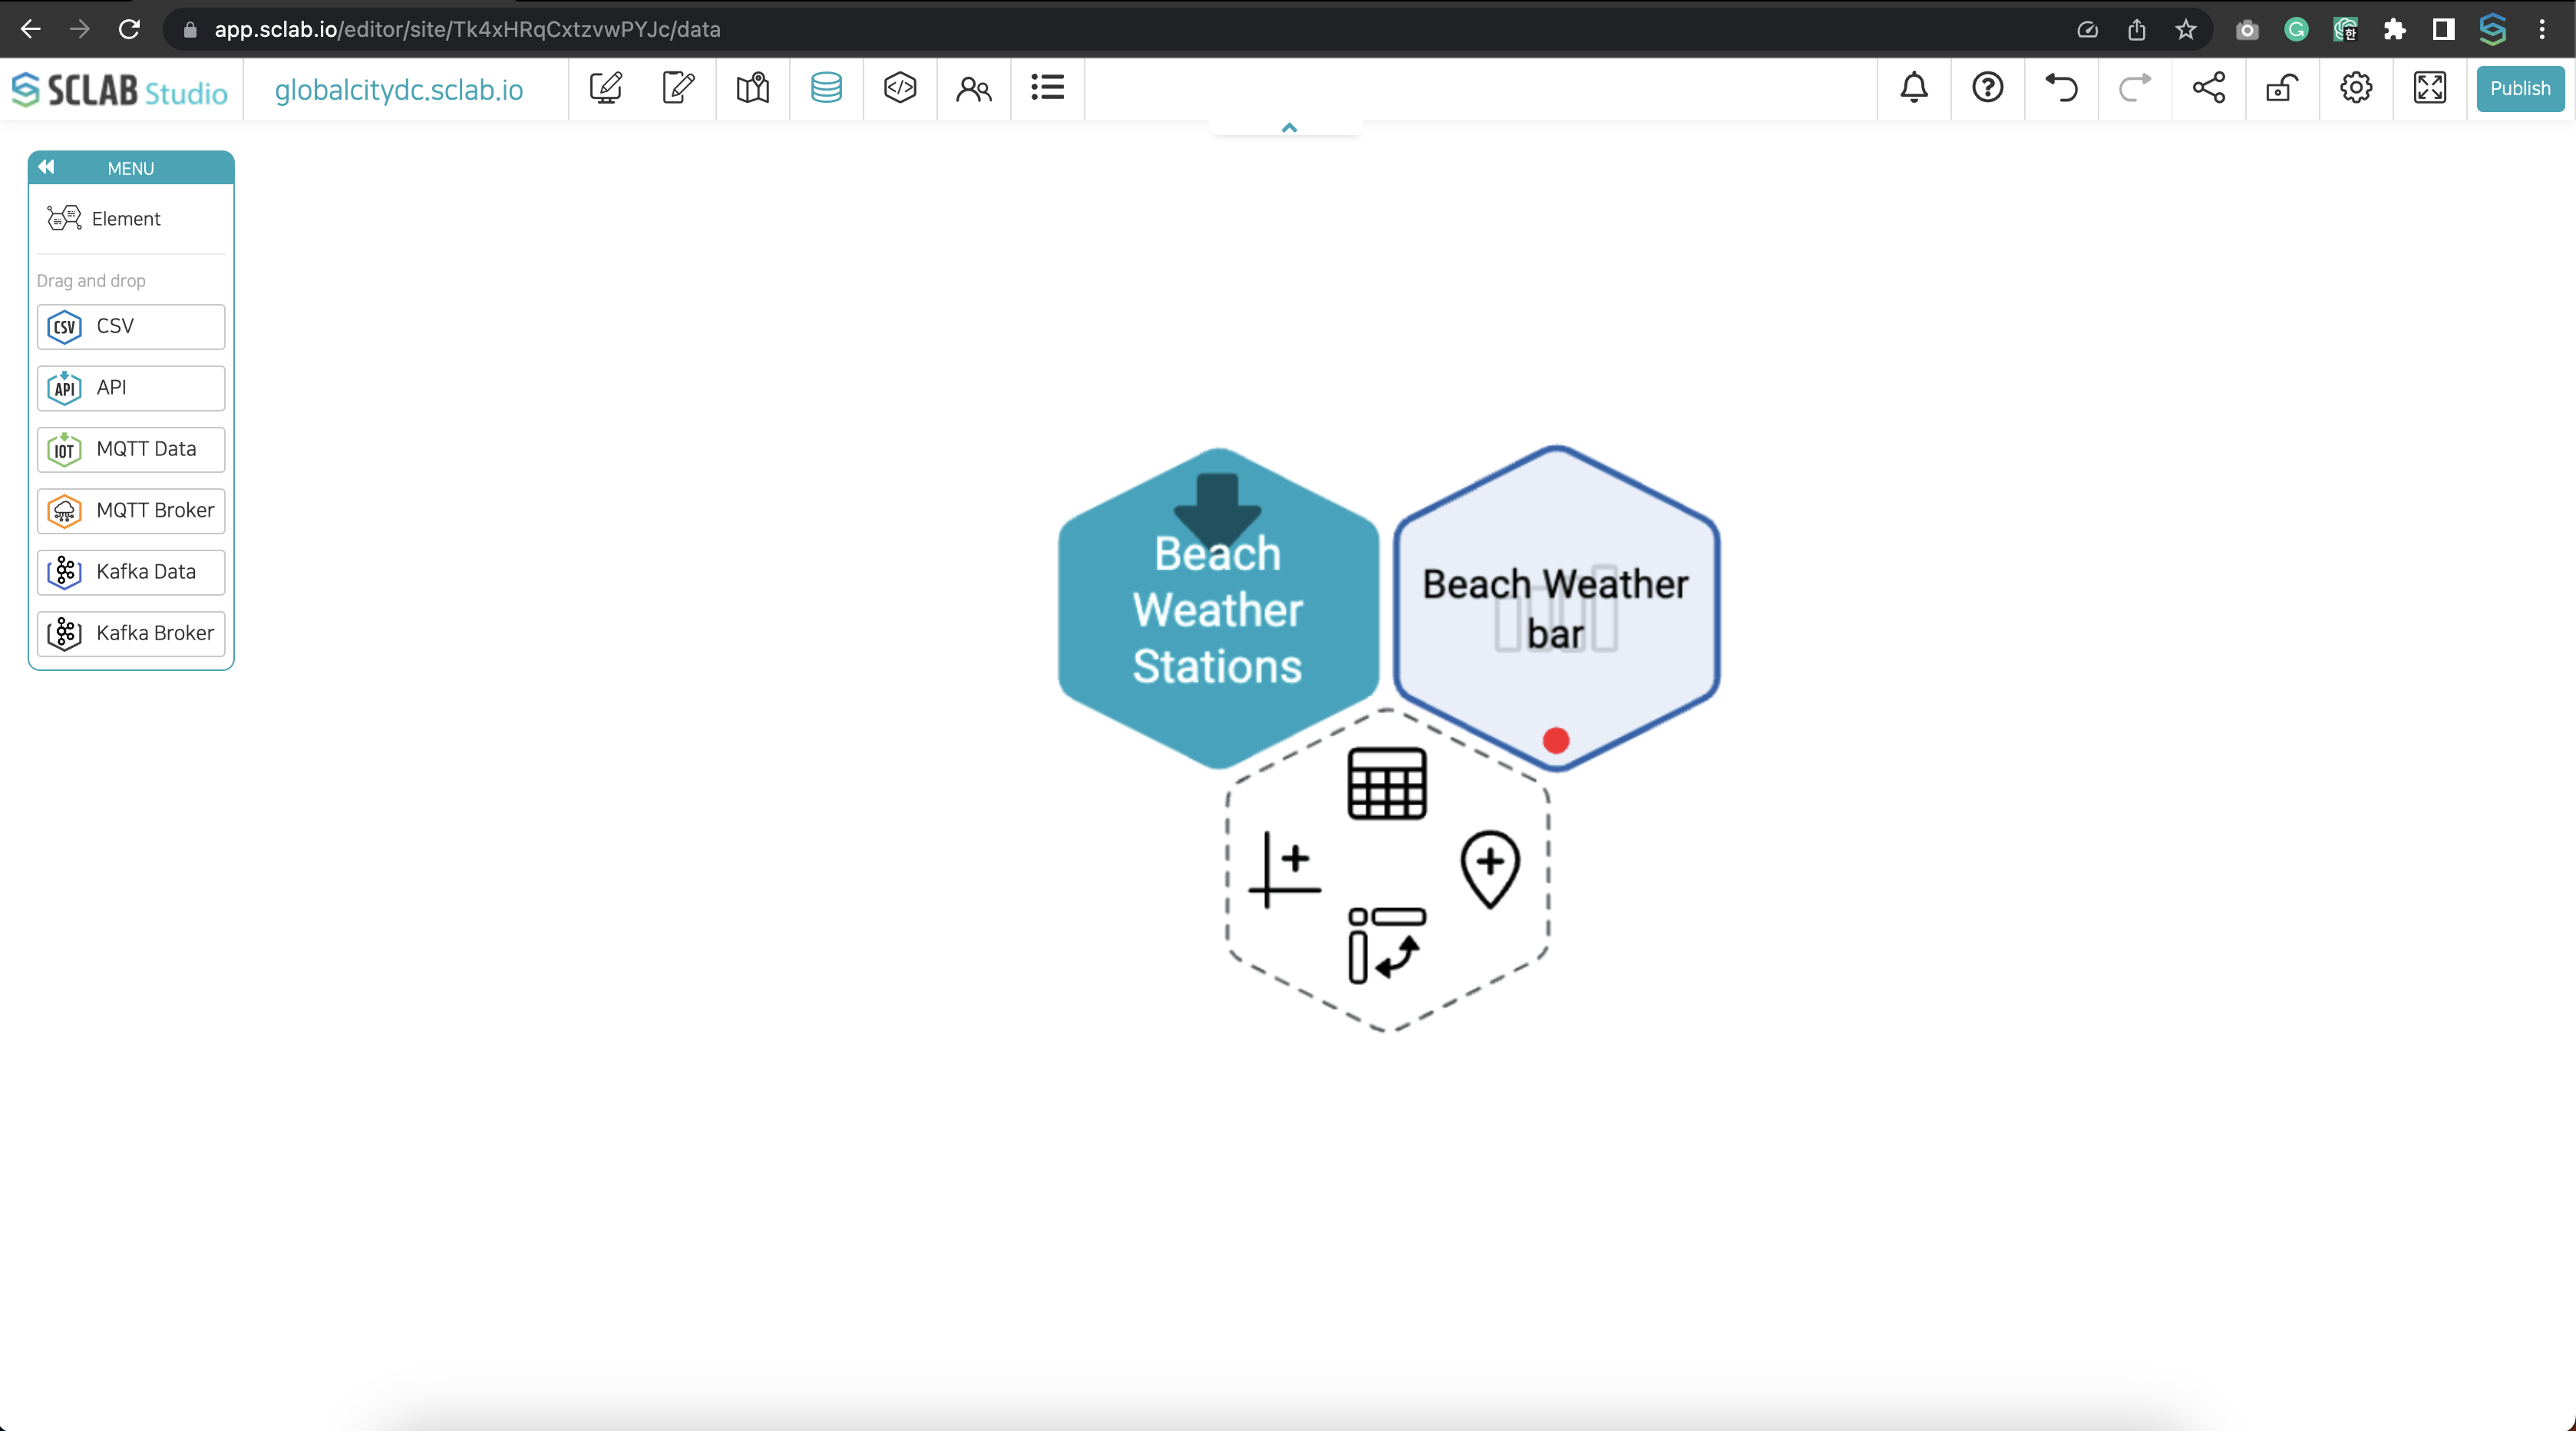
Click the chart shape on the left of the hexagon icon on the right of the hexagon icon of API, IoT, and CSV files.
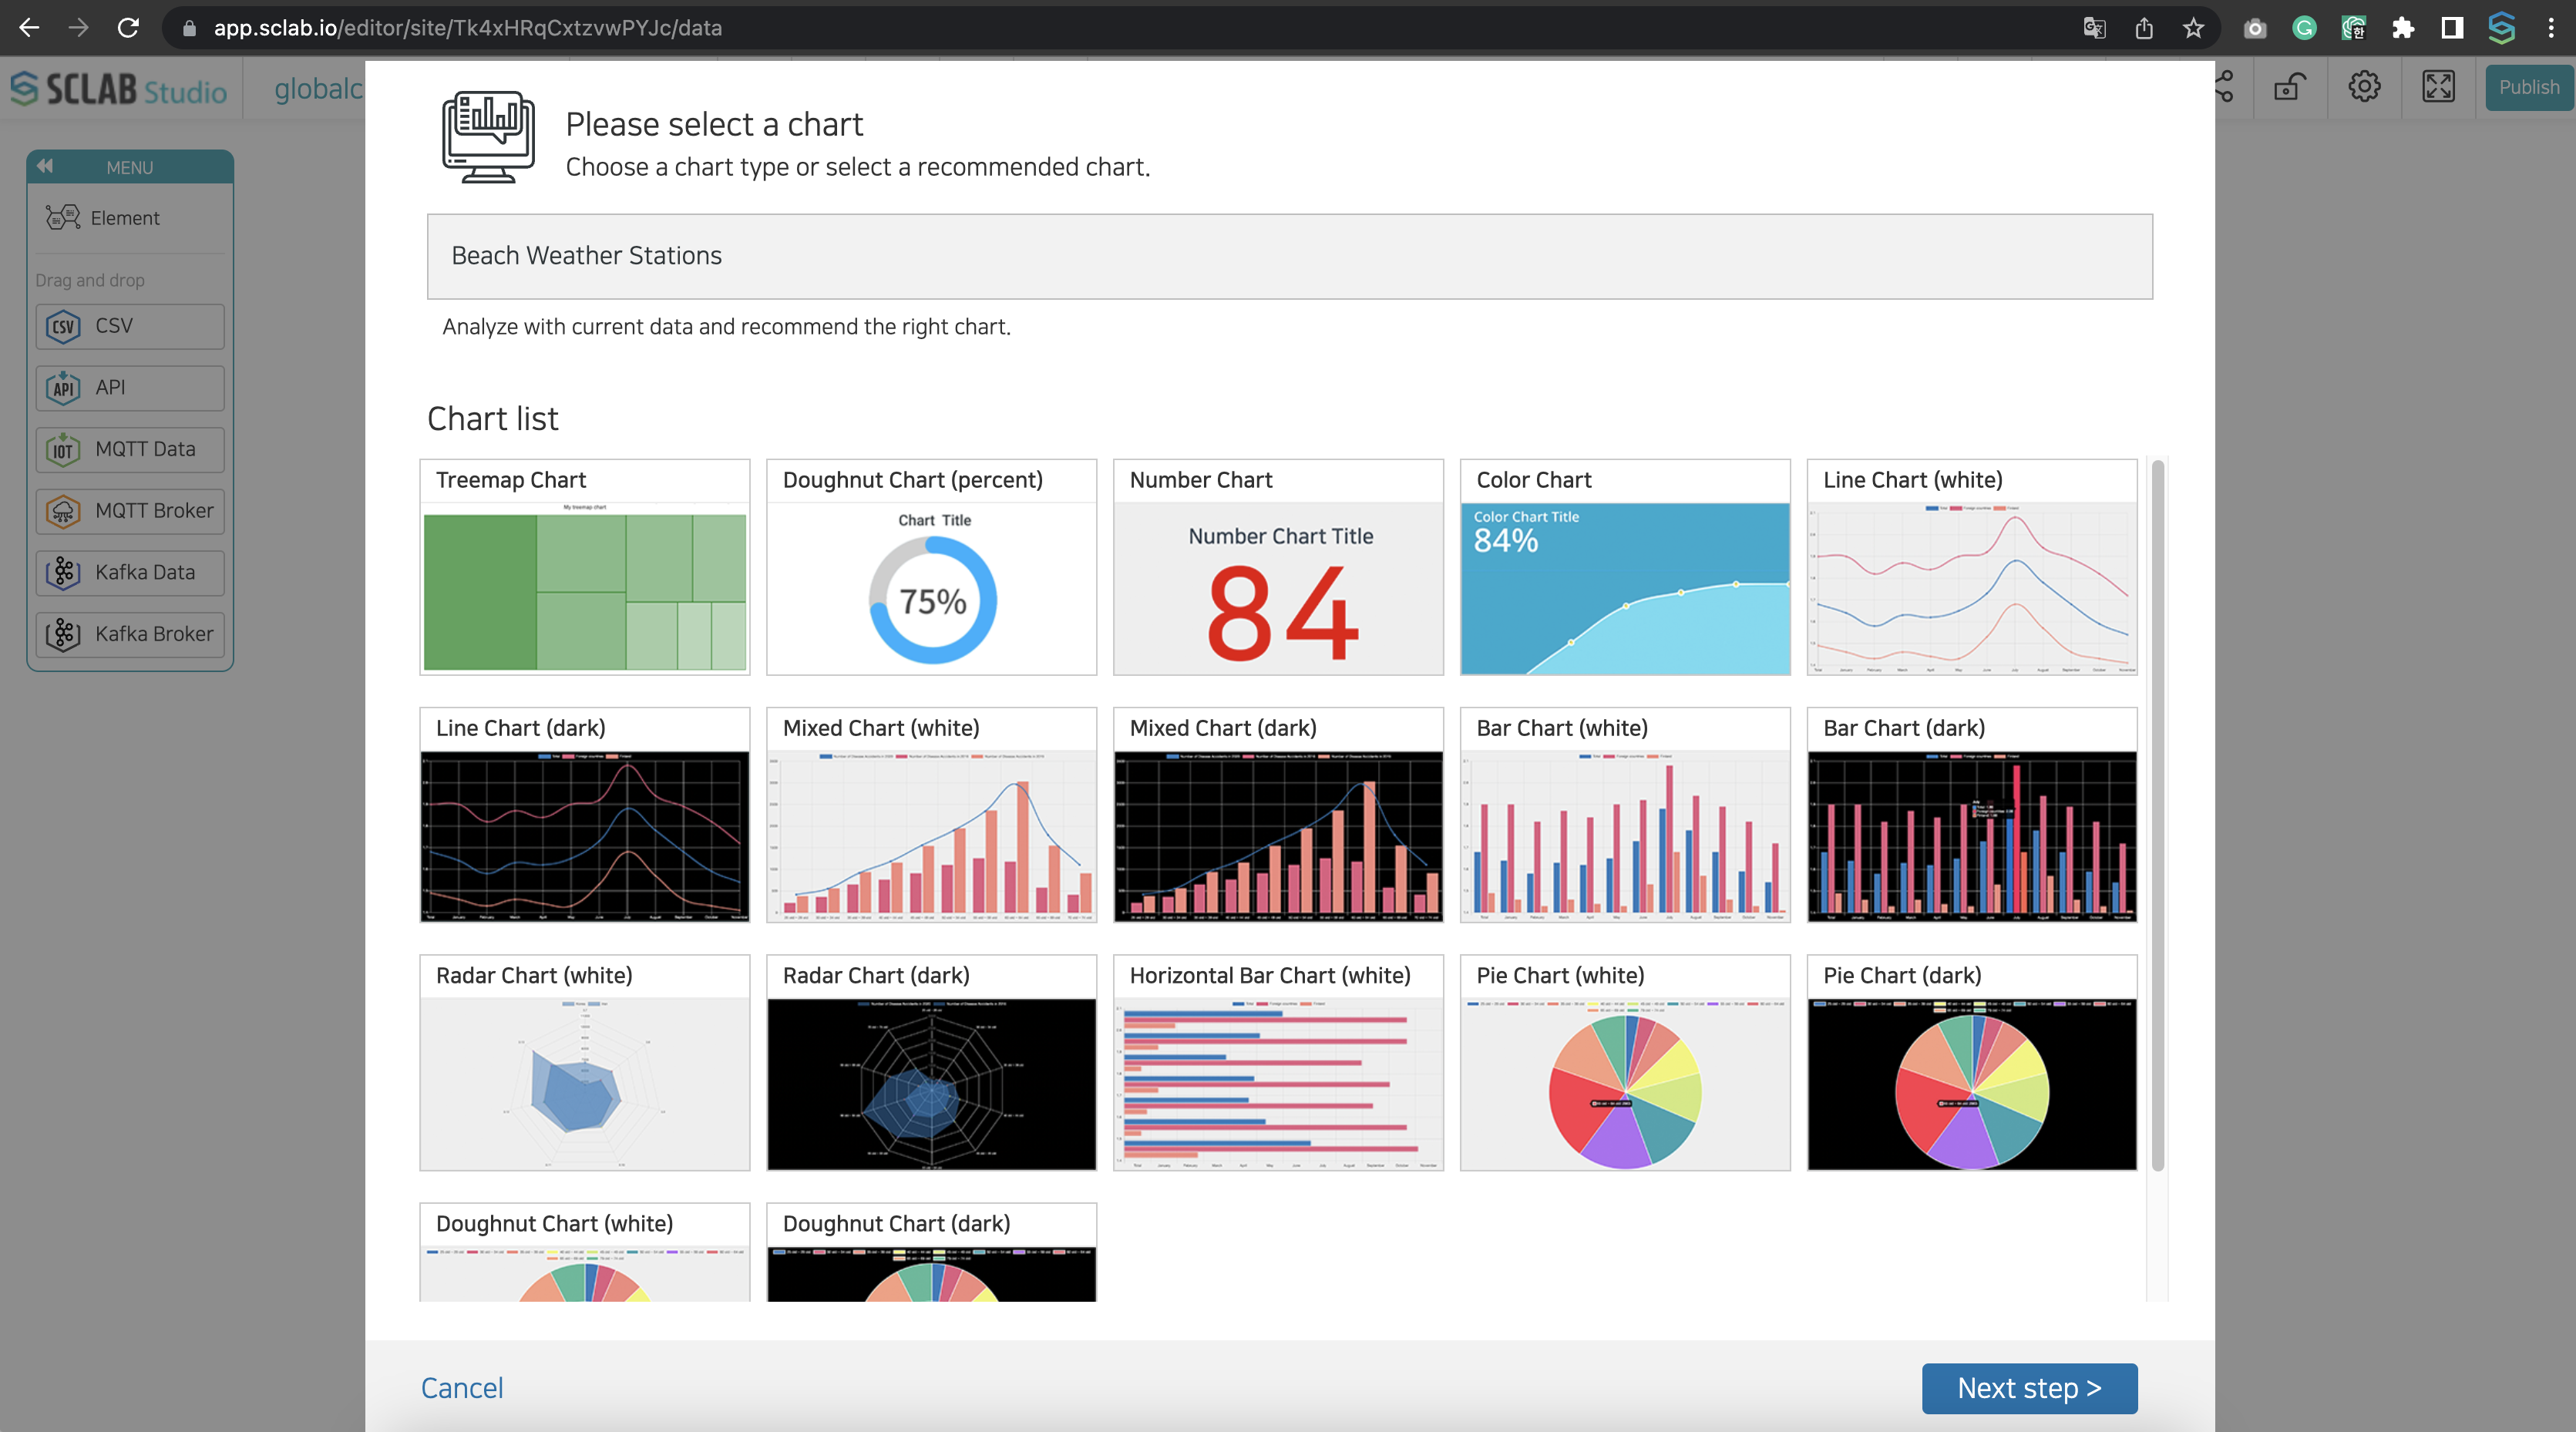
• Select the type of chart you want to create and click Next Step. Here we choose Bar Char.
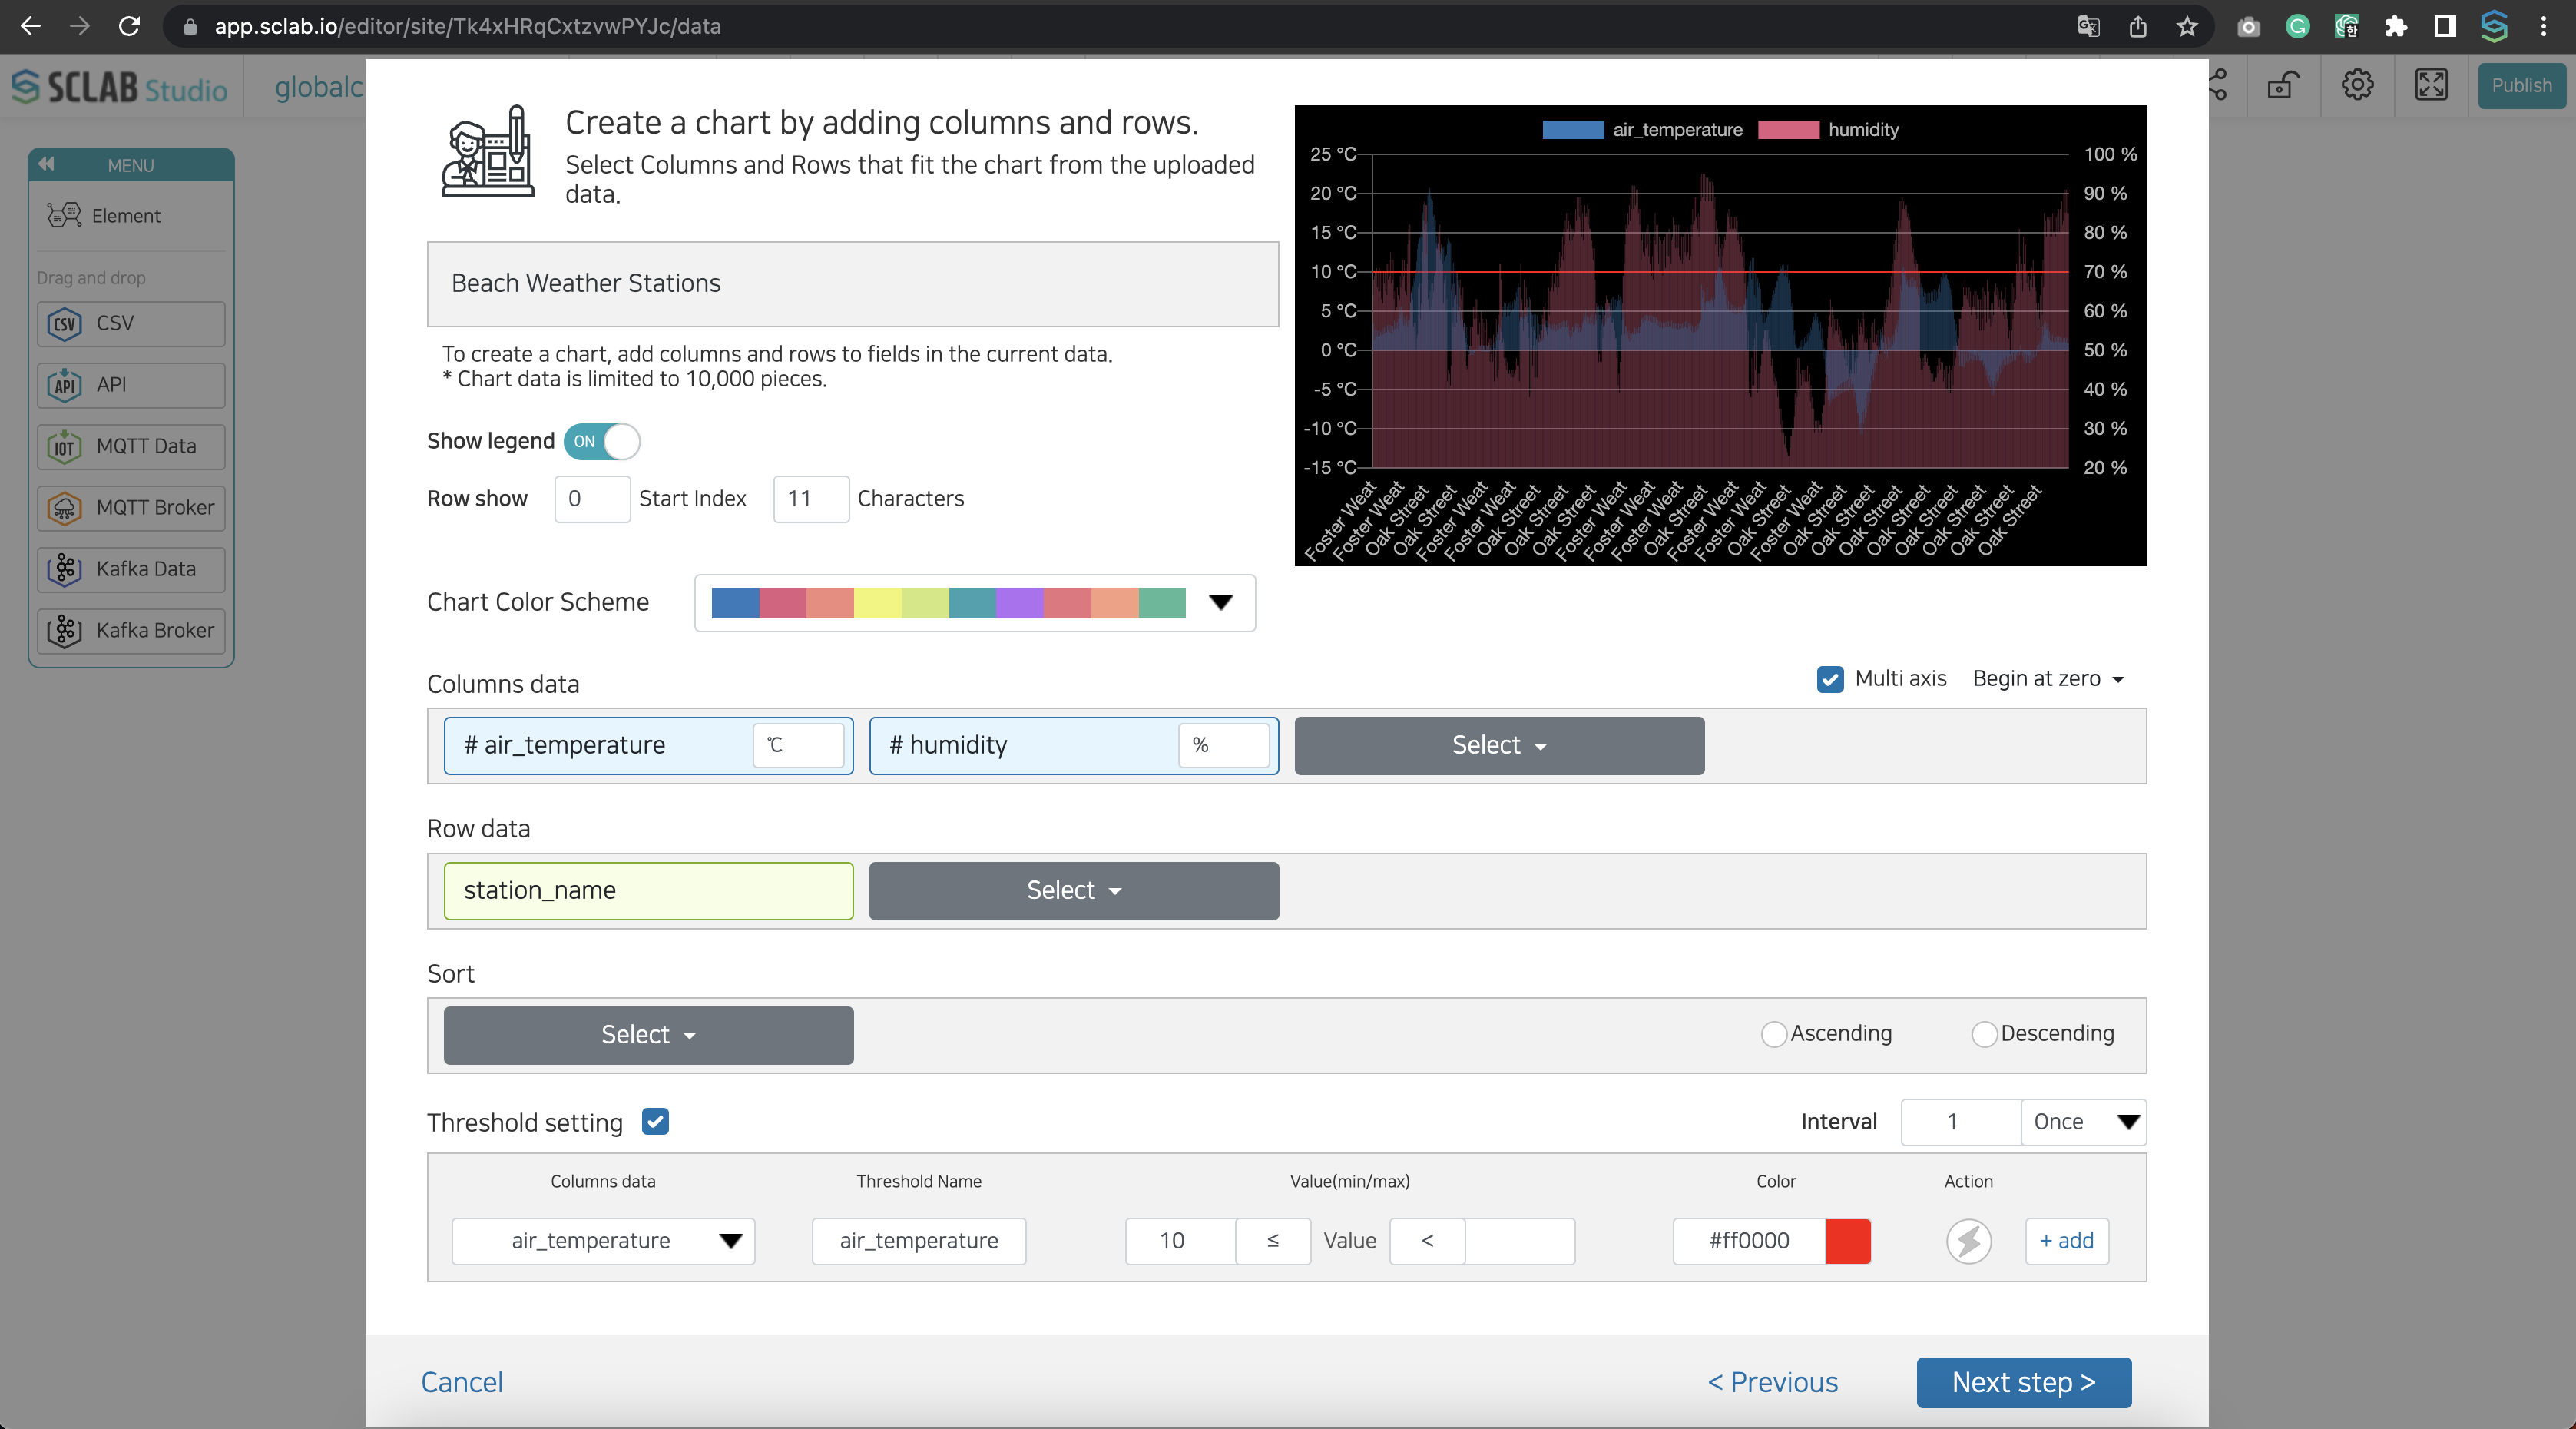
Select whether to expose the legend of the chart.
You can adjust the starting point and the number of characters shown in a row.
Select a chart color combination from the chart color scheme.
If you check the multi-axis at the top right of column data, the column data method at the bottom changes to the multi-column data method setting method.
If you select data from column data and enter a unit, the unit appears in multi-column data.
If you select the data you want to set as chart 0 at the top right of the column data, the chart standard is set.
Select row data.
If necessary, data can be arranged in ascending or descending order, or a threshold can be set. Set the data to set the threshold, name, value, and color of the threshold.
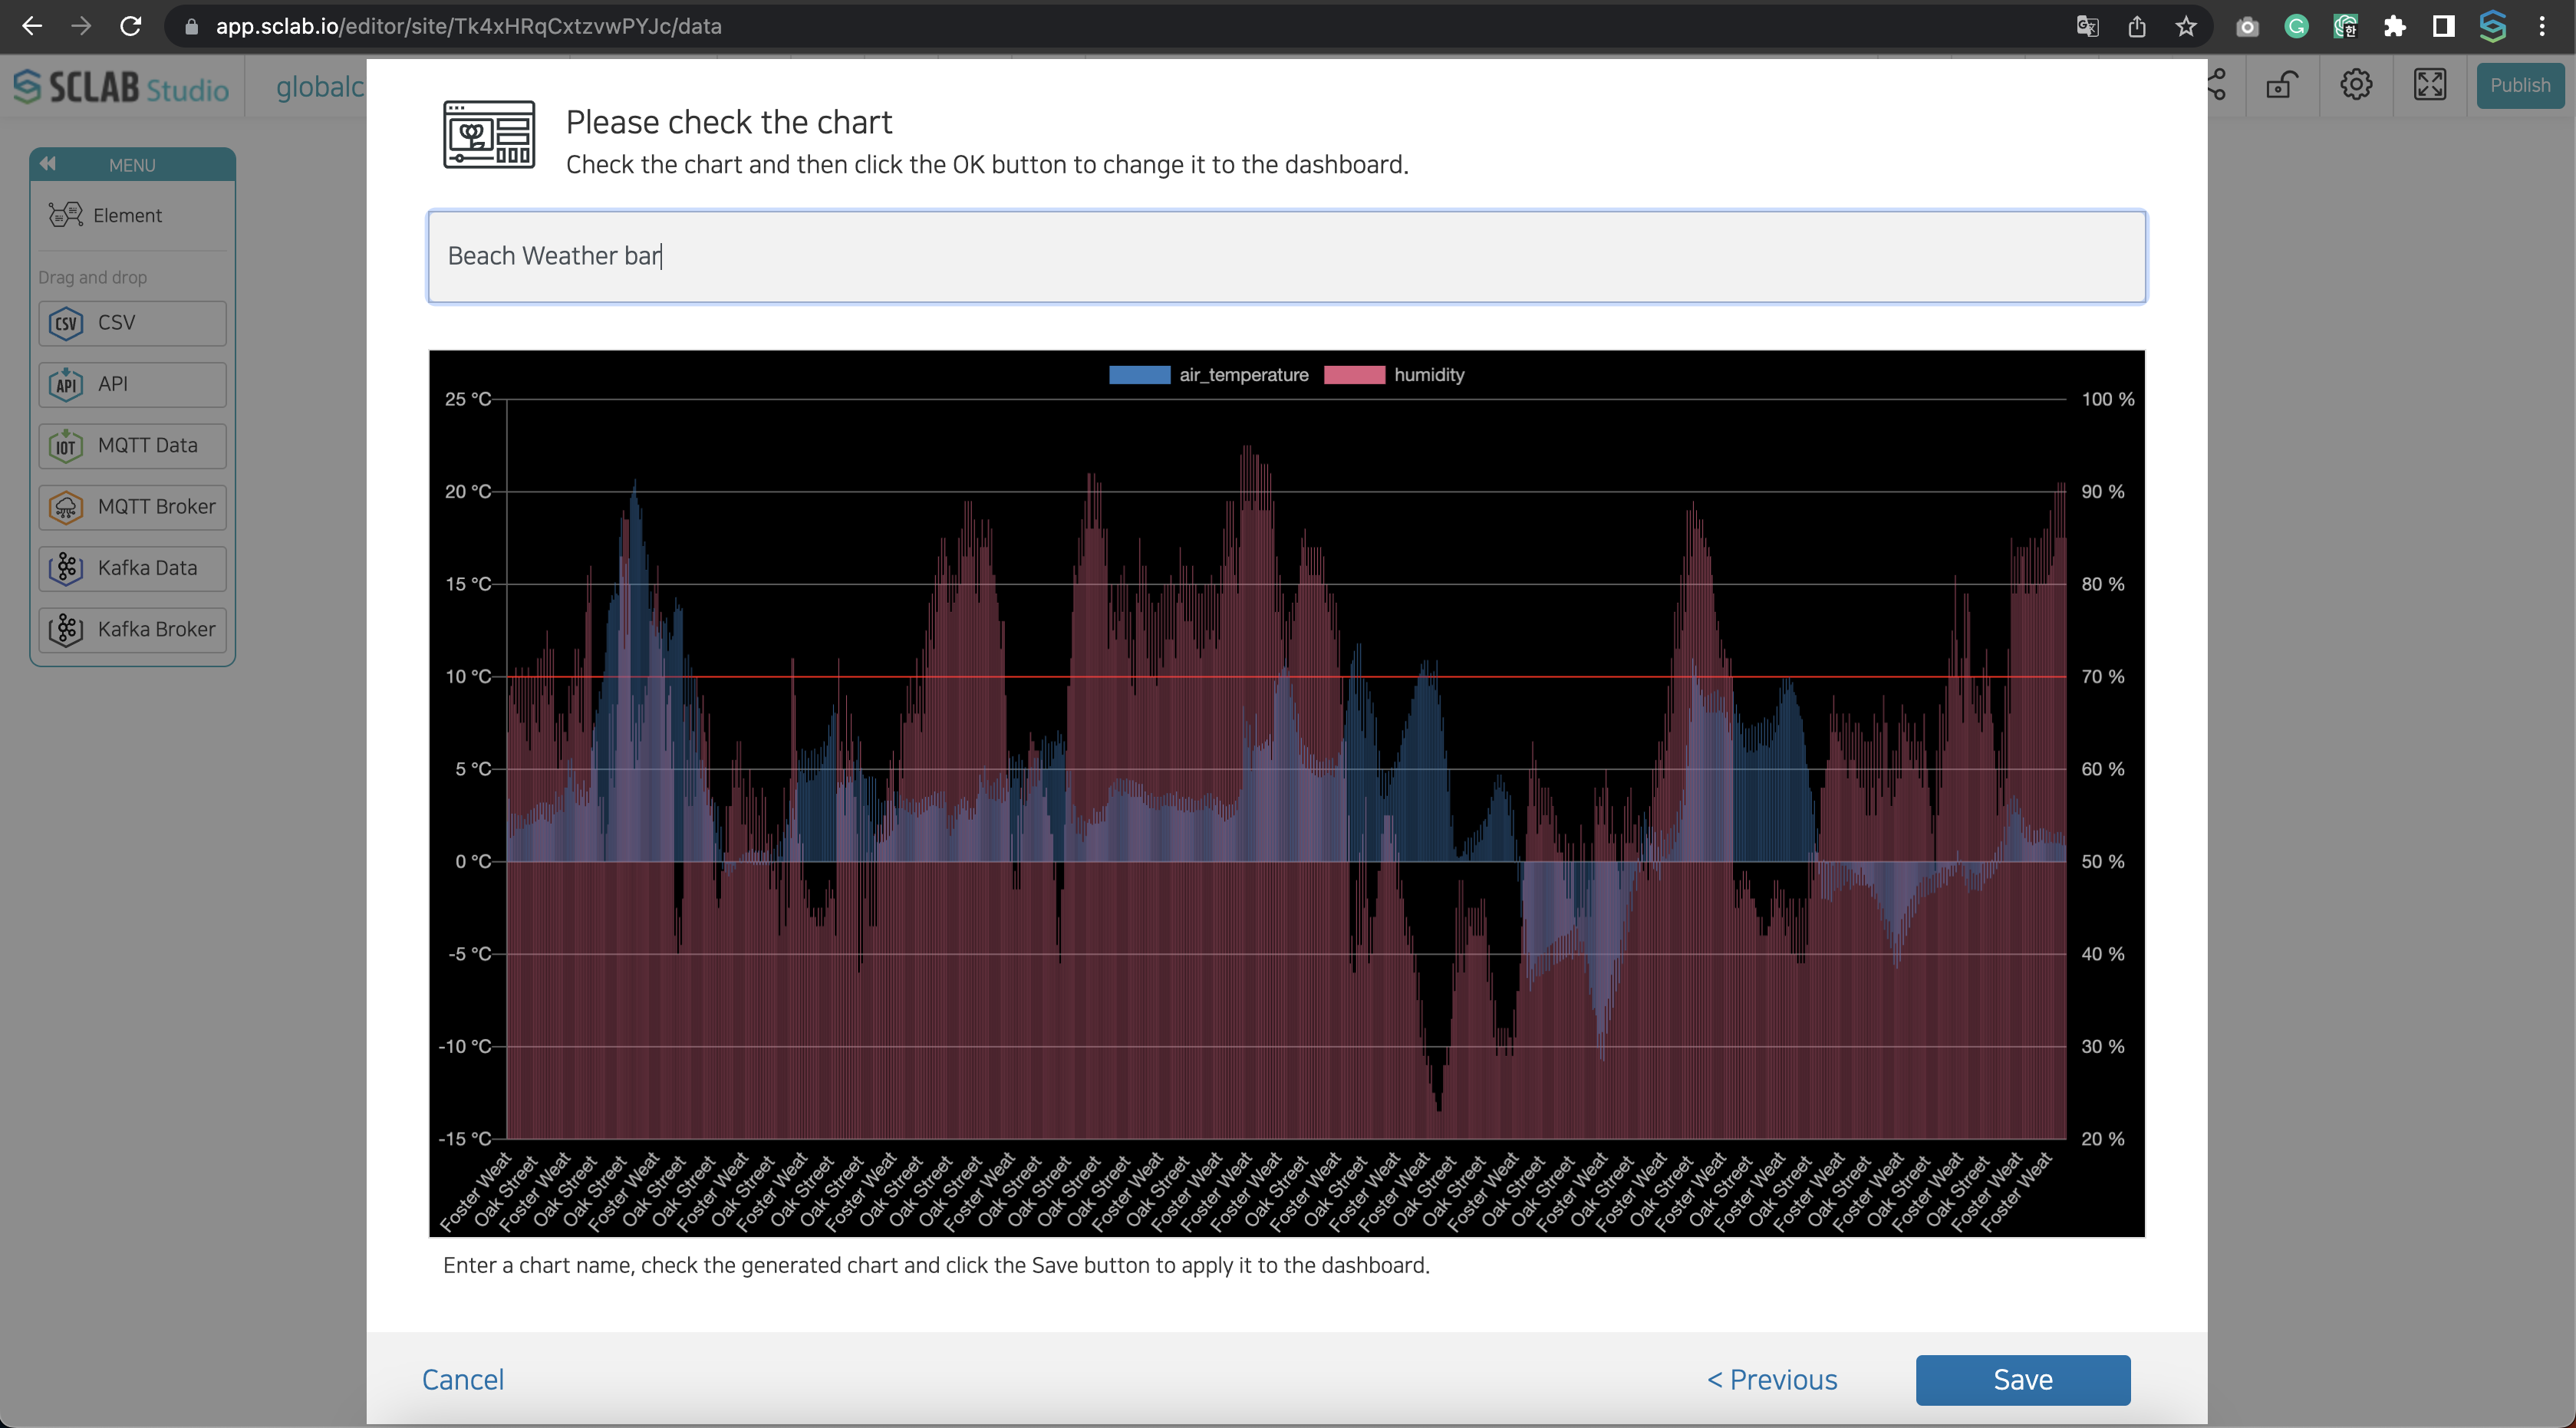
After checking the chart, enter the name and click the Save button.
You can see that a chart icon is created to the right of the hexagon icon.